The Vibeary — collection
Data Visualization & Charts
Charting is where most side projects fall down — either the library is too heavy or it cannot draw the one thing you need. This shelf splits the field into charting engines, D3 plugins, graph and network renderers, maps and geo, diagrams-as-code, and dashboard or notebook environments, so you can pick by the shape of your data instead of by popularity.
Inside Data Visualization & Charts
Gems in this collection
Protomaps
Serves an entire planet-scale basemap as a single static PMTiles file read over HTTP range requests.

Unovis
Framework-agnostic dataviz core with official React, Angular, Svelte, Vue and Solid wrappers, styled entirely through CSS custom properties.
LayerChart
Composable Svelte chart primitives covering cartesian charts, geo maps, hierarchies, force graphs and calendars from one layout system.

CodeBoarding
Generates interactive architecture diagrams directly from a codebase so documentation follows the source.
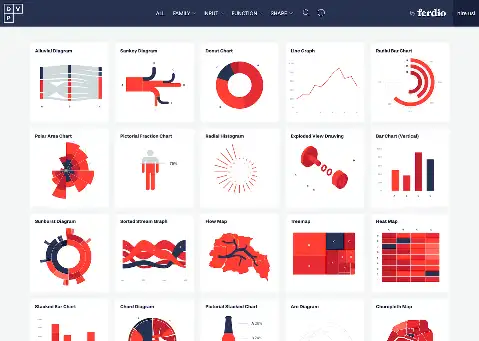
Data Viz Project
Catalogue of 200+ chart and diagram types filterable by function, input data shape and visual form.

RAWGraphs
Browser app that turns pasted spreadsheet data into unusual chart types — alluvial, bump, streamgraph — and exports SVG for Illustrator.
Git Heat Map
Visualises a git repository as a treemap coloured by how much each file has changed over a period.
Reaflow
Modular React diagram engine using ELK.js for automatic layout, with node nesting, drag-drop and undo/redo.
Reagraph
WebGL graph visualisation for React with 2D and 3D layouts, clustering, path finding and lasso selection built in.

tablecn
Data table and data grid built on shadcn/ui and TanStack Table with sorting, filtering, faceting and URL state.
sankeydiagram.net
Web app for generating budget and flow Sankey diagrams from text input, aimed at personal finance and energy flows.
shumoku
Generates network topology diagrams from YAML with 900+ vendor icons and NetBox integration.
OpenFreeMap
Free hosted vector tile service with custom styles, self-hostable from the same open stack.
MapLibre GL JS
Community fork of Mapbox GL JS rendering interactive vector tile maps in WebGL under a permissive licence.
colormap-shaders
GLSL shader implementations of over 100 named colormaps for use in WebGL and GPU visualisations.
SankeyMATIC
Browser tool that builds publication-quality Sankey diagrams from a plain-text flow list with full styling control.
d3-voronoi-treemap
Treemap layout that packs hierarchies into arbitrary shapes using Voronoi tessellation instead of nested rectangles.
graph-scroll
Minimal scroll-driven event library for D3 graphics, sized for a single explanatory piece rather than a framework.
Lightdash
Open-source BI layer that turns dbt models directly into explorable dashboards without a separate metric definition.
xyflow (React Flow / Svelte Flow)
Node-based UI libraries for React and Svelte with minimap, controls, custom nodes, edge routing and viewport helpers.
d3-geo-voronoi
Spherical Voronoi diagrams and Delaunay triangulation computed on the globe rather than a flat plane.
Juggl
Interactive, stylable and expandable graph view for Obsidian built on Cytoscape.js with a CSS-like styling language.
treeviz
Small library for rendering customisable interactive tree diagrams from JSON with collapsible nodes.
Maputnik
Visual editor for the MapLibre style specification with live preview, running fully in the browser.

Evidence
Business intelligence as code: write markdown with SQL blocks and get a fast static data site with interactive charts.
asciigraph
Go package that draws line graphs as ASCII art for terminal dashboards and CLI tools.
chart.xkcd
SVG chart library that draws in xkcd comic style with wobbly axes, hand-lettered labels and cartoon tooltips.

Rill
BI tool defining dashboards in YAML and SQL over DuckDB and ClickHouse, with a local dev mode and semantic layer.
ai2html
Adobe Illustrator script that exports artboards as responsive HTML text over a background image, per breakpoint.

paletteer
Unified R interface to 2500+ colour palettes from dozens of packages under one consistent naming scheme.
RevoGrid
Virtual data table web component with spreadsheet-like editing, grouping and filtering, usable from any framework.

Neovis.js
Renders Neo4j query results directly as styled graph visualisations in the browser without an intermediate data layer.
Plottable
Modular chart components on D3 where axes, plots and layout are separate objects you compose into custom chart types.
Observable Framework
Static site generator for data apps where build-time data loaders precompute snapshots so dashboards load instantly.
swoopy-drag
Tool for hand-placing curved swoopy annotation arrows on D3 charts and exporting the resulting coordinates.
roughViz
Charting library that renders bar, donut, scatter and line charts in a sketchy hand-drawn style via rough.js.
Lightweight Charts
TradingView's canvas financial charting library covering candlesticks, volume and indicators in a ~45KB bundle.
tinycolormap
Header-only single-file C++ library providing viridis, magma, inferno, turbo and other perceptual colormaps.
nothing-to-watch
WebGL gallery arranging thousands of film posters into a Voronoi treemap with force-directed exploration.

basement scrollytelling
React and GSAP library for declarative scroll-driven animation timelines with waypoints and parallel tweens.
scroller (rdmurphy)
Sub-1KB scrollytelling library exposing enter/exit events for steps with no dependencies or framework assumptions.
venn.js
Area-proportional Venn and Euler diagram layout that solves circle positions numerically from set sizes.
Semiotic
React dataviz framework built around annotation, network and ordinal frames rather than chart-type presets.
spark
Twenty-line shell script that prints sparklines in the terminal from any list of numbers piped to it.

Pintora
Extensible text-to-diagram library rendering to SVG or Canvas in the browser and to PNG/JPG/SVG in Node, with a plugin system for new diagram types.
Martin
Rust tile server serving PostGIS tables, MBTiles and PMTiles as vector tiles with automatic source discovery.
LyteNyte Grid
Zero-dependency React data grid offering headless or pre-styled modes with pivoting, grouping and server-side data.
chart-parts
Grammar of graphics for React from Microsoft Research, a React-native reimplementation of Vega's compositional model.
Grape
Swift library for force simulation and graph visualisation with SIMD-accelerated layout for Apple platforms.
d3-beeswarm
Layout plugin that computes non-overlapping beeswarm arrangements for one-dimensional distributions, so every individual data point stays visible.
billboard.js
D3-based reusable chart library from Naver with a compact API, plugin system and unusually complete TypeScript definitions.
3d-force-graph
Three.js component rendering force-directed graphs in 3D with node objects, link particles and camera controls.
heatmap.js
Canvas heatmap library for point-density overlays with configurable radius, gradient and blur, usable over maps or images.
missingno
Python library visualising missing-data patterns as matrix, bar, heatmap and dendrogram plots.
Redash
Query editor and dashboard tool that connects to dozens of SQL and NoSQL sources with scheduled refresh and alerts.
d3-force-3d
Fork of d3-force extending velocity-Verlet simulation to one, two or three dimensions.
d3-force-sampled
Drop-in replacement for d3-force using random vertex sampling for linear-time layouts on large graphs.
dataflow
Self-hosted Observable notebook editor supporting file attachments, secrets and custom standard libraries.
topogram
Generates continuous area cartograms from TopoJSON, distorting geography by a data value.
cloudgram
Generates cloud architecture diagrams from a concise code description of components and connections.
Layer Cake
Svelte graphics framework that handles scales, dimensions and responsive layout so you compose SVG, Canvas, WebGL and HTML layers yourself.
emerge
Browser-based interactive visualisation of codebase structure and dependencies across many programming languages.
colorgrad-js
Rust-and-WebAssembly colour gradient library exposing scientific colormaps and custom gradient construction to JavaScript.
d3-lasso
Free-form lasso selection for D3 charts, letting users draw around points to filter scatterplots.
Crossfilter
Library for fast multidimensional filtering of large datasets in the browser, powering coordinated linked views.
Lume
Vue 3 chart component library from Adyen built on D3 with a strict design-system-first component API.
poline
Generates colour palettes from positions on a 3D polyline through HSL space, producing unusual but coherent schemes.

Closeread
Quarto extension adding scrollytelling to reproducible documents so prose scroll steps drive plots and maps.
L7
WebGL geospatial visualisation framework from AntV with 3D extrusion, heatmaps and large point cloud layers.
diagram-js
Renderer and modelling toolkit underneath bpmn.io, providing canvas, palette, connection routing and undo for custom editors.
Kyrix
System for building pan-and-zoom visualisations over datasets too large for the client, with automatic server-side scaling.

d3-cloud
Word cloud layout that places words with sprite-based collision detection, running asynchronously so it never blocks the page.
WebCola
Constraint-based graph layout that supports alignment, non-overlap, flow direction and grouping constraints.
d3-inertia
Extends d3-drag so globe rotation keeps spinning with momentum after the pointer is released.
d3-loom
Layout for loom diagrams, a chord-diagram variant that shows relationships between entities and a shared centre.
geemap
Python package for interactive geospatial analysis and mapping on Google Earth Engine inside Jupyter.
d3-scale-cluster
Scale that bins continuous data into discrete classes using k-means clustering rather than quantile or equal-interval breaks.
uPlot
Canvas time-series chart library in ~50KB that renders 150k+ points in milliseconds with near-zero CPU on streaming data.
graphviz-visual-editor
Web app for editing Graphviz DOT graphs visually and textually at the same time, with live bidirectional sync.
PlotJuggler
Qt desktop application for plotting and inspecting time-series logs from robotics, ROS and CSV sources with drag-drop layouts.

floweaver
Python library that reshapes flow datasets into Sankey diagrams via a definition of groupings and partitions.
Smoothie Charts
Tiny canvas library dedicated to live streaming timelines that scroll smoothly at 60fps with configurable delay buffers.

d3-interpolate-path
Path interpolator that handles transitions between paths with different numbers of points without visual jumping.
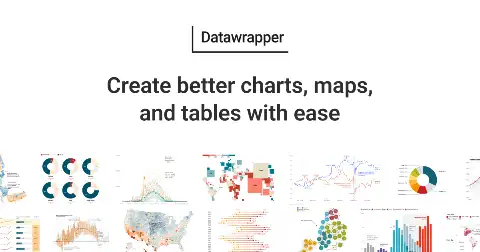
Datawrapper Academy
Free documentation-plus-theory site covering chart choice, colour, annotation and map design from the Datawrapper team.
Mural
Self-hosted tool for building visual scrolling stories with video, audio and image backgrounds, no code required.
Cubism.js
D3 plugin for horizon charts, a time-series encoding that stacks many metrics in a fraction of the vertical space.
d3-dag
Layout algorithms for directed acyclic graphs — Sugiyama, zherebko and grid — as a d3-hierarchy-style module.
d3-node
Renders D3 charts and maps to static SVG on the server for emails, PDFs and social cards.
TauCharts
Grammar-of-graphics chart library built around facets and declarative data mapping rather than per-chart-type config objects.

Panel
HoloViz framework for building Python data apps that works with matplotlib, Plotly, Bokeh, Altair and Vega output together.
lit-line
SVG line-chart web component under 3KB that is interactive, responsive and works in any framework or none.

marimo
Reactive Python notebook stored as plain .py, with SQL cells and one-command deployment as an interactive app.
observable-prerender
Headless renderer that runs Observable notebooks and exports cells as PNG, SVG or PDF for automation pipelines.
EventDrops
Time-based event series visualisation showing dense dot timelines per row, with zoom and brushing.

CodeFlower
Renders a codebase as a force-directed flower where each file is a leaf sized by lines of code.
FT Visual Vocabulary
Financial Times poster and source files classifying chart types by the relationship they express, plus Chart Doctor examples.
Scientific Visualisation: Python & Matplotlib
Open-access book on the theory and craft of scientific figures, with full source for every figure.
d3-jetpack
Convenience wrappers over D3 selections adding appendMany, translate, at/st shorthands and tspan wrapping.
ChartGPU
WebGPU-rendered charting library aimed at datasets large enough to stall canvas and SVG renderers.
react-force-graph
React bindings for 2D, 3D, VR and AR force-directed graphs sharing one declarative prop API.
Graphology
Framework-agnostic graph data structure for JavaScript with a large standard library of layouts, metrics and community detection.
vapeplot
Matplotlib extension supplying vaporwave palettes and colormaps for deliberately non-corporate chart aesthetics.
d3-area-label
Places labels inside stacked area bands at the largest fitting position, sized and rotated automatically.
d3-flame-graph
Flame graph component for profiling and any hierarchical data, with search, zoom and differential comparison modes.
d3-upset
UpSet plot implementation for visualising intersections across many sets where Venn diagrams break down.
d3.sketchy
D3 plugin that generates sketchy backgrounds, hatched shapes and wobbly lines to give any D3 chart a drawn texture.
Jspreadsheet CE
Lightweight JavaScript spreadsheet component with formulas, cell types, formatting and Excel-style keyboard behaviour.
visavail
Time-data availability chart showing when each series has data and where the gaps are.
From Data to Viz
Interactive decision tree mapping data shapes to appropriate chart types, with caveats and code in R, Python, D3 and React.
G6
Graph visualisation engine from AntV with built-in layouts, behaviours, edge bundling and large-graph WebGL rendering.
d3-annotation
Annotation layer for D3 with badge, callout, curve and threshold annotation types plus draggable editing during design.
d3-legend
Legend generator for D3 colour, size and symbol scales that stays in sync with the scale it was built from.
d3-composite-projections
Map projections that place distant territories such as Alaska, Hawaii and French overseas regions next to the mainland.
Vizzu
Animated chart library that morphs between chart types along a continuous geometry so transitions carry meaning in data stories.

Drawnix
Open-source whiteboard combining mind maps, flowcharts and freehand drawing on one infinite canvas.
VivaGraphJS
Graph drawing library with swappable layout and rendering backends, including a WebGL renderer tuned for very large graphs.
d3fc
Component set for financial and technical charts on D3 that renders identical series to SVG, Canvas or WebGL from one definition.
d3-geo-scale-bar
Generates correct scale bars for projected geospatial data, accounting for distortion at the bar's location.
vizdom
Zero-dependency TypeScript diagrams-as-code library that produces layouts without bundling Graphviz or a headless browser.
react-simple-maps
React SVG mapping components built on d3-geo, aimed at static thematic maps rather than slippy tile maps.
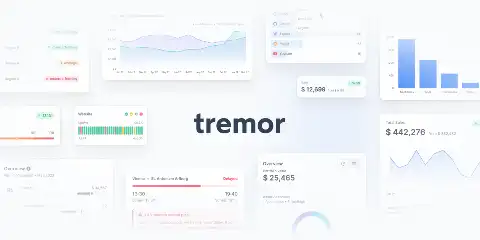
Tremor
Thirty-five open-source React dashboard components — charts, KPI cards, filters, pickers — built on Recharts, Radix and Tailwind.
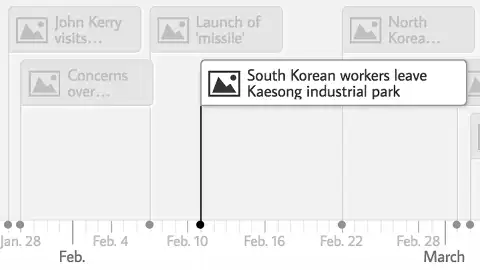
Timeline (KnightLab)
Tool that builds interactive media-rich timelines from a Google Sheet with no code.
CSSV
Plain-text format that puts a CSS style block on top of CSV data, plus a cssv-table element that renders it as a styled HTML table.
shadcnmaps
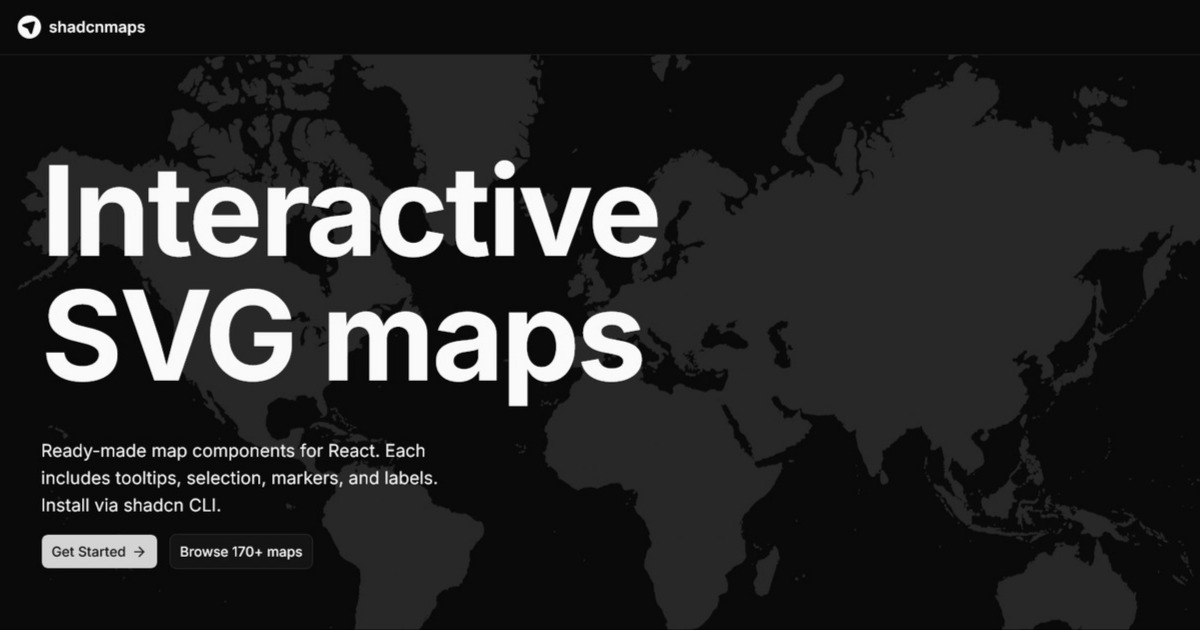
170+ interactive SVG map components for countries, continents and US states with tooltips, selection, markers, zoom and keyboard navigation, installed via shadcn CLI.
Orchid Charts
JavaScript SVG charts for dashboards, activity calendars, and release timelines, with responsive layouts and CSS theming.
Visited Map
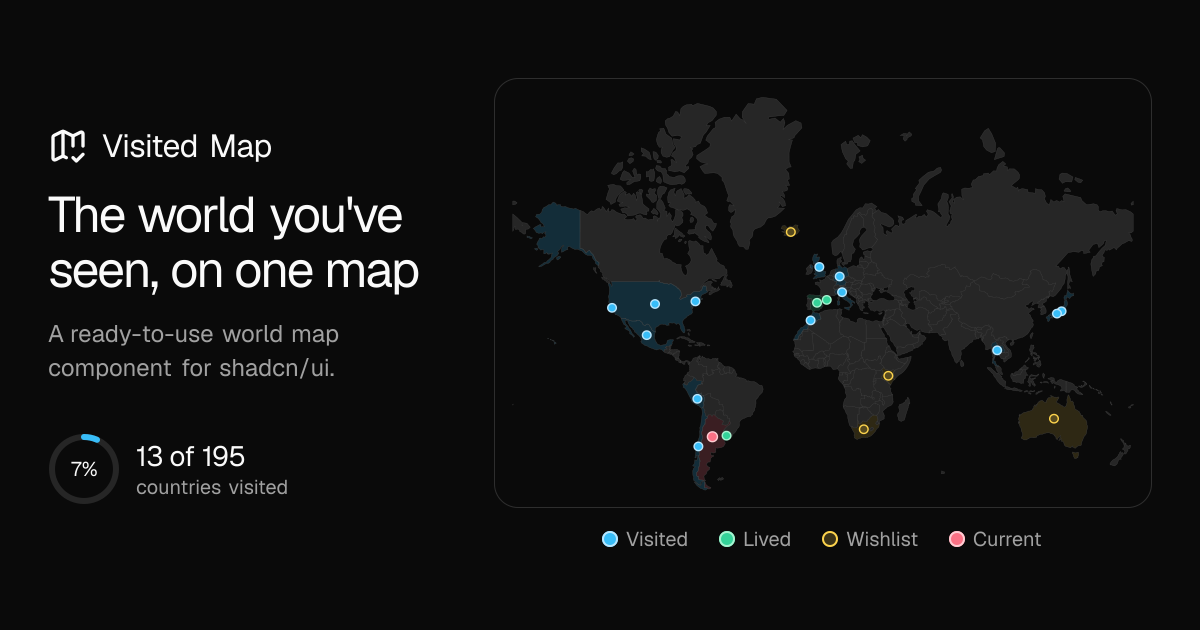
shadcn/ui world map component that plots visited, lived and wishlist countries plus pinned cities, rendered as server-side SVG with a map builder.
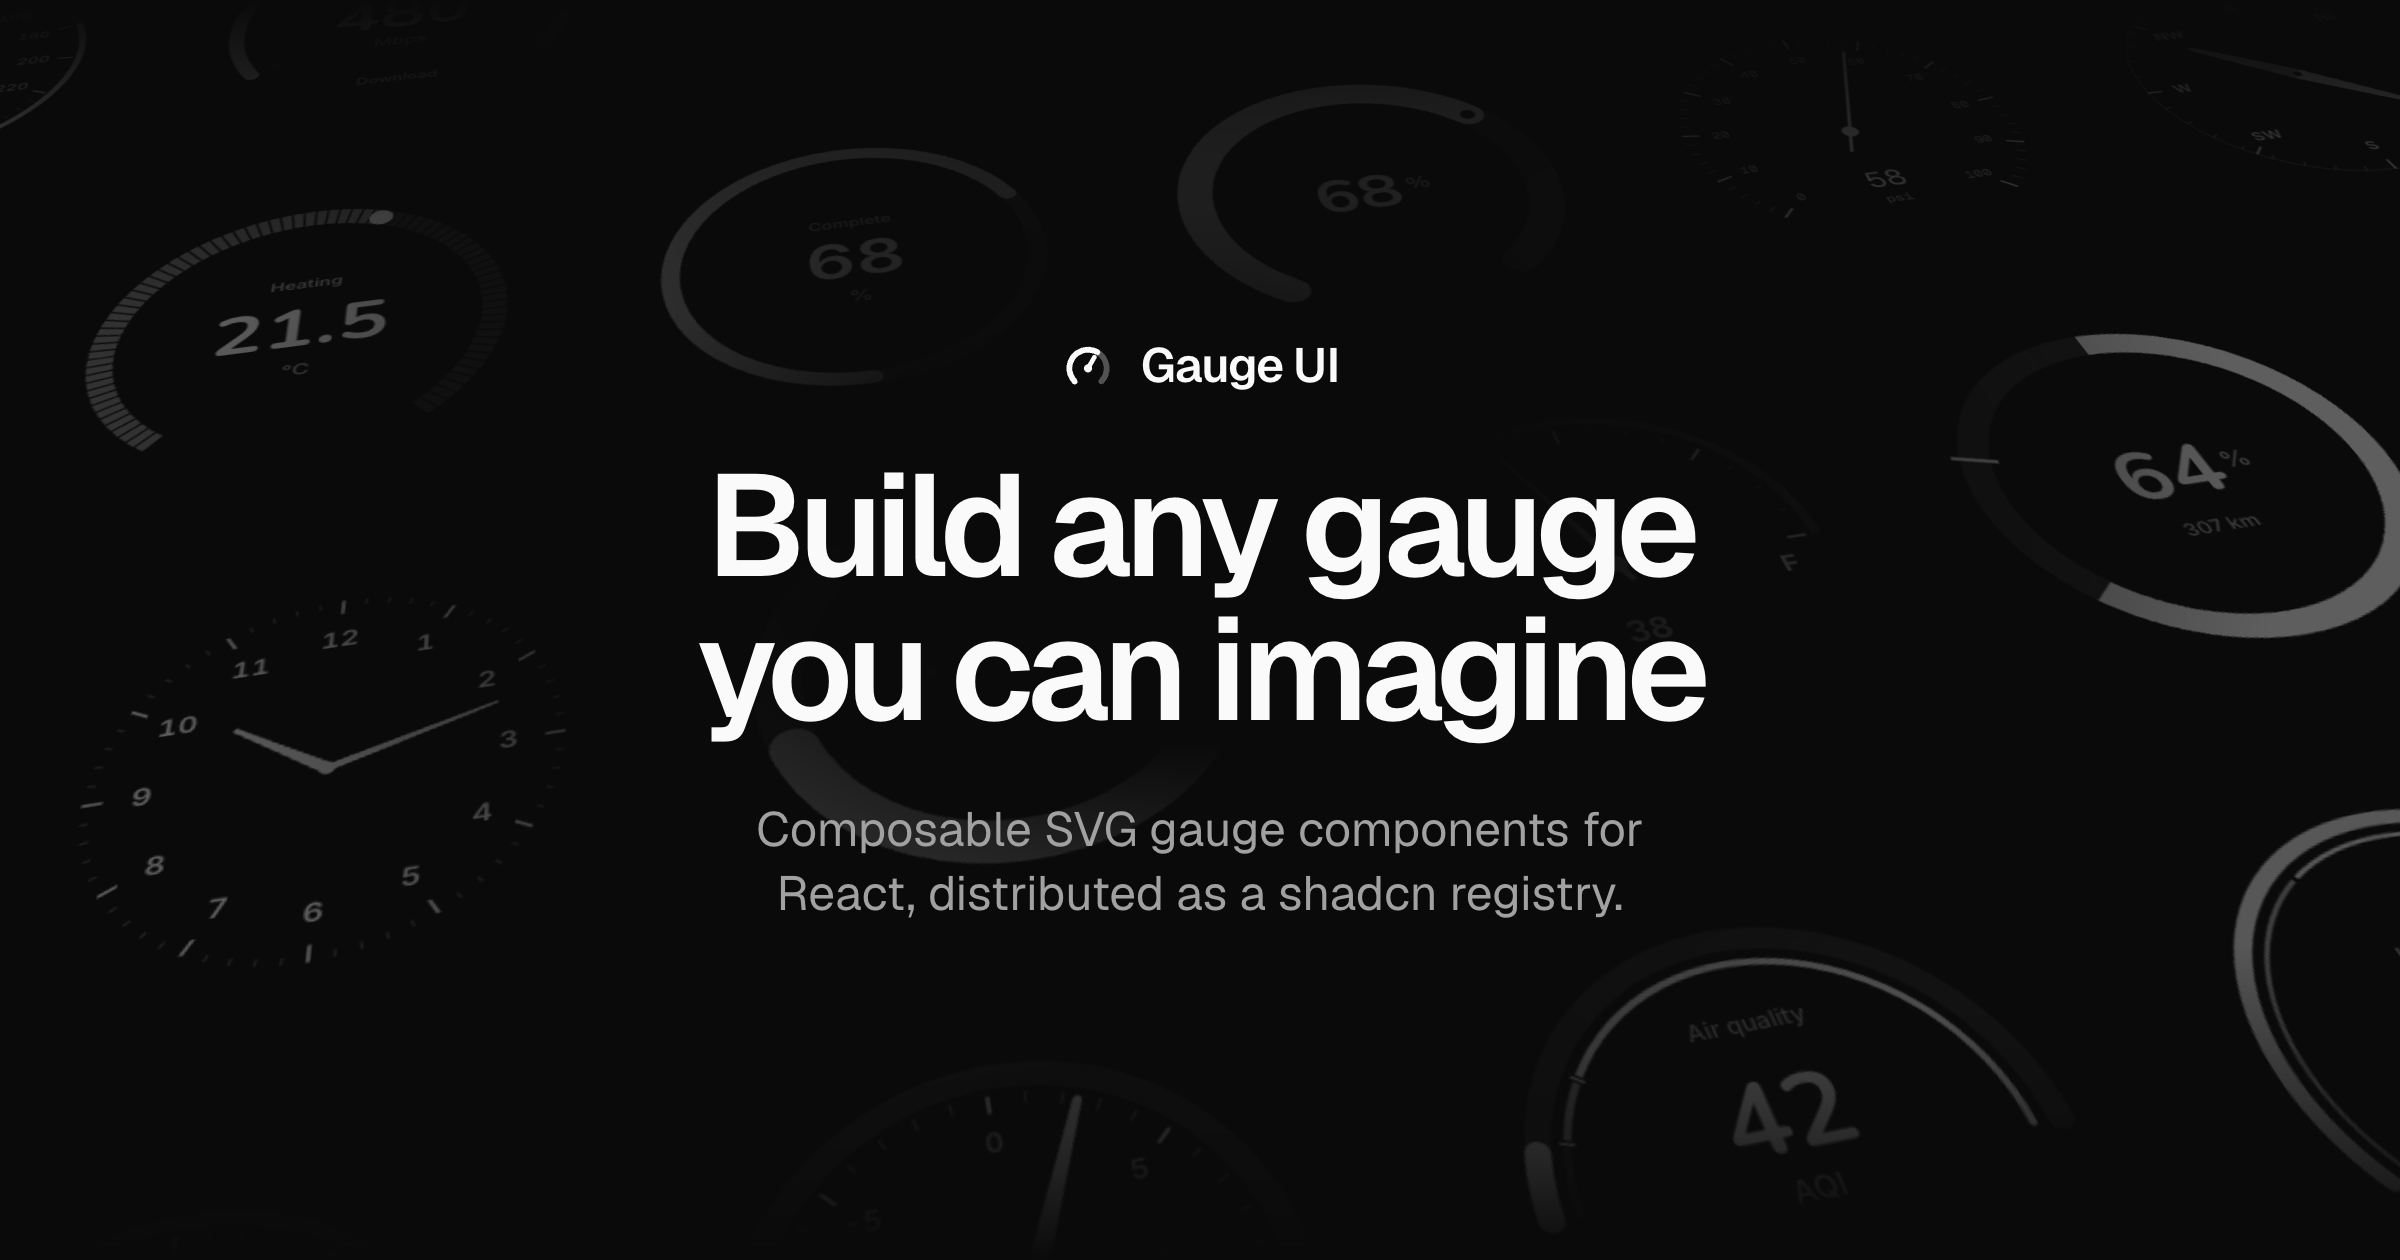
Gauge UI
Composable SVG gauge primitives for React, distributed as a shadcn registry with live composition examples.
LLM Attention Visualization
Browser tool that runs a local Transformers.js model and paints which past tokens shaped each generated token.

mcdview
Drop a SQL, Prisma, DBML, pgModeler or MySQL Workbench file and get an interactive ER diagram behind one shareable link, with a CI API.
Rainform
Turns 25 hourly rainfall values into a draggable Three.js particle rainscape where curtain, waterfall, ripples and audio follow the curve.
ModelMap
Generates interactive animated architecture diagrams for any Hugging Face model, showing layers and tensor flow you can step through.
Visimer
Embeddable WYSIWYG editor for Mermaid diagrams — drag nodes, rename labels and change shapes, with Monaco and CodeMirror bindings plus a headless mode.
Glide Data Grid
Canvas-rendered React data grid handling millions of rows with native scrolling, inline editing and markdown/image cell types.
globe.gl
Three.js web component for 3D globes with arcs, points, hex bins, rings, polygons, paths and custom objects.
Frappe Charts
Zero-dependency SVG chart library with GitHub-style heatmaps, annotations and region markers in a very small bundle.

Techan.js
D3 plugin for stock and financial charts with candlestick, OHLC, trendline and crosshair components.
WaveDrom
Renders digital timing diagrams and register maps from a compact JSON description, in browser or CLI.
Textures.js
D3 module that generates SVG pattern fills — lines, circles, paths — for encoding categories without relying on colour alone.
X6
AntV diagram library for building DAG editors, ER diagrams and flowcharts with built-in interaction primitives.
Perspective
Streaming analytics component with a C++/WebAssembly query engine, pivot UI and Apache Arrow ingest, usable as a web component or Jupyter widget.
Dygraphs
Interactive time-series chart library built for hundreds of thousands of points with range selectors, synchronisation and error bands.

Sigma.js
WebGL graph rendering engine for large networks with pluggable programs for node and edge shapes, paired with Graphology.
Reaviz
React chart library with unusually strong defaults for radial, sankey, treemap and calendar heatmap types plus built-in motion.
D2
Declarative diagram language with three pluggable layout engines, sketch mode, adaptive dark mode and animated multi-board diagrams.
d3-x3d
Data-driven 3D charts rendering to X3D/X3DOM, covering 3D bar, scatter, surface and bubble charts.