The Vibeary — round-up
Best diagram-as-code tools
Diagrams drawn in a canvas app rot the moment the system changes, because nobody wants to reopen the file. Diagram-as-code fixes the incentive: the diagram is text, it lives next to the code, it diffs in a pull request, and an AI agent can update it as part of the same change. This shelf collects the mature text-to-diagram tools — flowcharts, sequence diagrams, architecture views, ERDs — along with the renderers you need to embed them in docs or a site.
What earned a place
- Plain-text source that diffs cleanly in git
- Renders in docs, README or the browser without a service
- Layout engine good enough to avoid manual nudging
- Free and open source
16 picks from the library
- 01
cloudgram
Generates cloud architecture diagrams from a concise code description of components and connections.
Why it made the list: Architecture diagrams that live in the repo and diff in pull requests
Diagrams as codeMITJacopo Sabbatini (@dedalusj)github.com

- 02
CodeBoarding
Generates interactive architecture diagrams directly from a codebase so documentation follows the source.
Why it made the list: Architecture docs that regenerate from source instead of quietly rotting
Diagrams as codeopen-sourceCodeBoarding (@CodeBoarding)github.com

- 03
D2
Declarative diagram language with three pluggable layout engines, sketch mode, adaptive dark mode and animated multi-board diagrams.
Why it made the list: The only text-to-diagram language that produces animated, themed output
Diagrams as codeopen-sourceTerrastruct (@terrastruct)d2lang.com

- 04
diagram-js
Renderer and modelling toolkit underneath bpmn.io, providing canvas, palette, connection routing and undo for custom editors.
Why it made the list: The engine behind BPMN editors, reusable for any node-and-edge editor
Diagrams as codeMITbpmn.io / Camunda (@bpmn-io)github.com

- 05
- 06
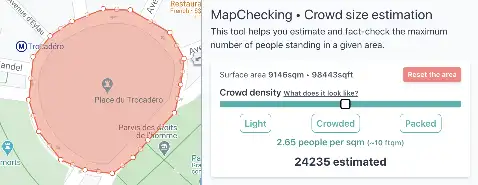
MapChecking
Draws an area on a map and estimates the maximum plausible crowd size within it at different densities.
Why it made the list: One input, one number, defensible methodology — perfect single-purpose tool design
MappingfreeAnthony Catel (@paraboul)mapchecking.com
- 07
mcdview
Drop a SQL, Prisma, DBML, pgModeler or MySQL Workbench file and get an interactive ER diagram behind one shareable link, with a CI API.
Why it made the list: A dozen schema formats in, one explorable page out — plus schema diffs and time-lapses.
Diagrams as codeopen-source@Gheopmcdview.dev

- 08
OpenInfraMap
Global interactive map of power lines, telecoms, solar, oil, gas and water infrastructure built on OSM data.
Why it made the list: Infrastructure rendered beautifully at planet scale; superb cartographic styling
Mappingopen-sourceRuss Garrett (@russss)openinframap.org

- 09
Overpass Turbo
Web IDE for querying and visualising arbitrary OpenStreetMap data with instant map rendering of results.
Why it made the list: Turns OSM into a queryable database; powers custom map data pipelines
Mappingopen-source@tyroverpass-turbo.eu

- 10
PeakVisor
Pairs a 2D map with a 3D rendered terrain model so photographs can be matched against mountain skylines.
Why it made the list: Skyline matching against 3D terrain is a delightfully specific, well-executed idea
MappingfreemiumRoutes Software SRLpeakvisor.com

- 11
Pintora
Extensible text-to-diagram library rendering to SVG or Canvas in the browser and to PNG/JPG/SVG in Node, with a plugin system for new diagram types.
Why it made the list: Mermaid-like syntax that doesn't inject global styles into your page
Diagrams as codeMIThikerpig (@hikerpig)github.com

- 12
ShadeMap
Simulates mountain, building and tree shadows anywhere on Earth for any date and time, rendered over a live map.
Why it made the list: Beautiful real-time global shadow rendering; useful far beyond investigation work
Mappingfreemiumshademap.app

- 13
shumoku
Generates network topology diagrams from YAML with 900+ vendor icons and NetBox integration.
Why it made the list: 900 vendor icons means your network diagram stops looking like boxes
Diagrams as codeopen-sourceAkitoshi Konoe (@konoe-akitoshi)github.com

- 14
Visimer
Embeddable WYSIWYG editor for Mermaid diagrams — drag nodes, rename labels and change shapes, with Monaco and CodeMirror bindings plus a headless mode.
Why it made the list: Maps rendered SVG back to a CST, so edits preserve your comments and formatting.
Diagrams as codeMITInkeepgithub.com

- 15
vizdom
Zero-dependency TypeScript diagrams-as-code library that produces layouts without bundling Graphviz or a headless browser.
Why it made the list: Graph layout in pure TS — no wasm Graphviz blob, no Puppeteer
Diagrams as codeopen-sourceVizdom (@vizdom-dev)github.com
- 16
WaveDrom
Renders digital timing diagrams and register maps from a compact JSON description, in browser or CLI.
Why it made the list: Timing diagrams as data — the only sane way to document protocols
Diagrams as codeMITAliaksei Chapyzhenka (@drom)wavedrom.com


Questions
- Can AI agents maintain these diagrams?
- Yes — that is one of the strongest arguments for text-based diagrams. An agent can update the source alongside the code change.
- Do these work in GitHub READMEs?
- Several render natively on GitHub; others export SVG you can commit.